Nasdaq's V-Recovery Breaks New Ground: Why This Rally Defies Fed Policy
Despite high interest rates, Nasdaq just staged its third major V-shaped recovery since 2018. But unlike previous rallies driven by Fed stimulus, four new catalysts are powering this breakout to all-time highs.
Overview
The Nasdaq Composite's dramatic surge to new all-time highs represents one of the most compelling V-shaped recoveries in modern market history. After falling nearly 20% in early 2025 amid trade uncertainties and economic headwinds, the tech-heavy index has roared back with unprecedented momentum, breaking through key resistance levels and establishing new technical benchmarks.
This comprehensive analysis examines the technical patterns, institutional dynamics, and market forces driving this historic rally. We'll explore why V-shaped recoveries often signal sustained bull markets, identify the key support and resistance levels that matter most to traders, and analyze the broader implications for both active traders and long-term investors navigating this evolving landscape.
From the initial capitulation that marked the bottom to the volume-confirmed breakouts that established new highs, this recovery provides valuable insights into market resilience and the power of technical momentum. Understanding these dynamics is crucial for positioning strategies in what could be an extended bull market cycle.
Something Strange Just Happened
Wall Street loves a good comeback story, but the Nasdaq’s latest performance has traders scratching their heads. After tumbling nearly 20% from its peak earlier this year, the tech-heavy index didn’t just bounce back—it blasted through to fresh all-time highs in what can only be described as a textbook V-shaped recovery.
Here’s what makes this rally peculiar: it happened while the Federal Reserve kept interest rates at restrictive levels. Conventional wisdom says tech stocks need cheap money to thrive. Yet somehow, the Nasdaq shrugged off a 5.25% federal funds rate and delivered one of its most impressive recoveries on record.
This isn’t the first time we’ve witnessed such a dramatic reversal. The question that’s keeping institutional investors awake isn’t whether V-shaped recoveries work—we know they do. The real puzzle is figuring out what’s driving this one when the usual suspect (Fed stimulus) is nowhere to be found.
The Pattern We’ve Seen Before
Before diving into what makes 2025 different, let’s acknowledge the elephant in the room: this exact scenario has played out twice in recent memory. The charts tell a story that’s both familiar and unsettling.
Take a look at these three recoveries side by side, and you’ll notice something remarkable about how markets behave when they hit genuine oversold conditions.
The 2018 Precedent: When the Fed Blinked
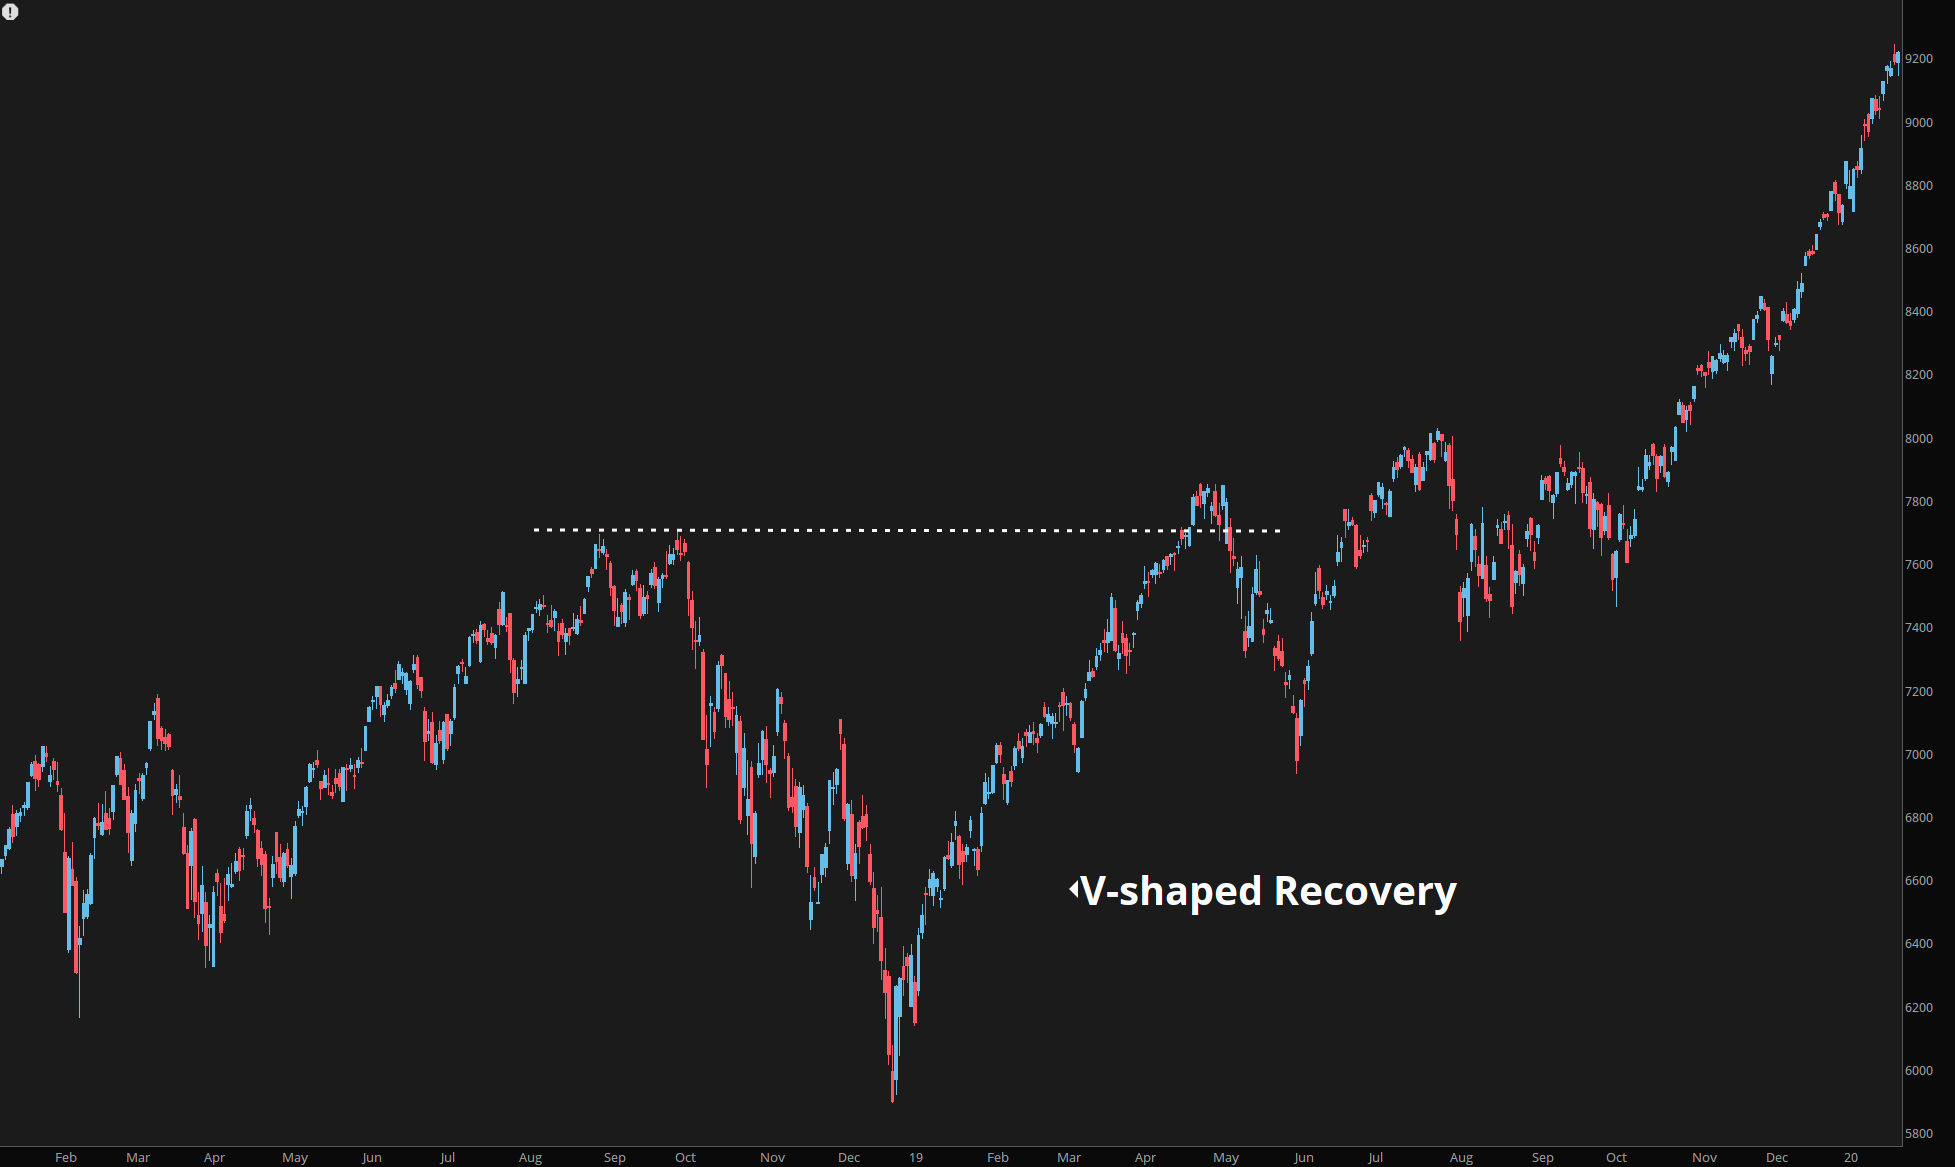 December 2018: Nasdaq crashes 23% as Powell’s Fed signals aggressive rate hikes, then rockets back when policy pivots
December 2018 was brutal. Jerome Powell’s Fed had been steadily raising rates, and his comments about being “a long way from neutral” sent markets into a tailspin. The Nasdaq shed 23% in three months as investors priced in a recession.
Then something interesting happened. The Fed’s tone shifted dramatically. By January 2019, Powell was talking about being “patient” with rate hikes. The central bank essentially capitulated to market pressure, and the Nasdaq responded with a ferocious rally that lasted through 2019.
The catalyst was clear: Federal Reserve stimulus through lower rates.
The 2020 Crash: Liquidity Tsunami
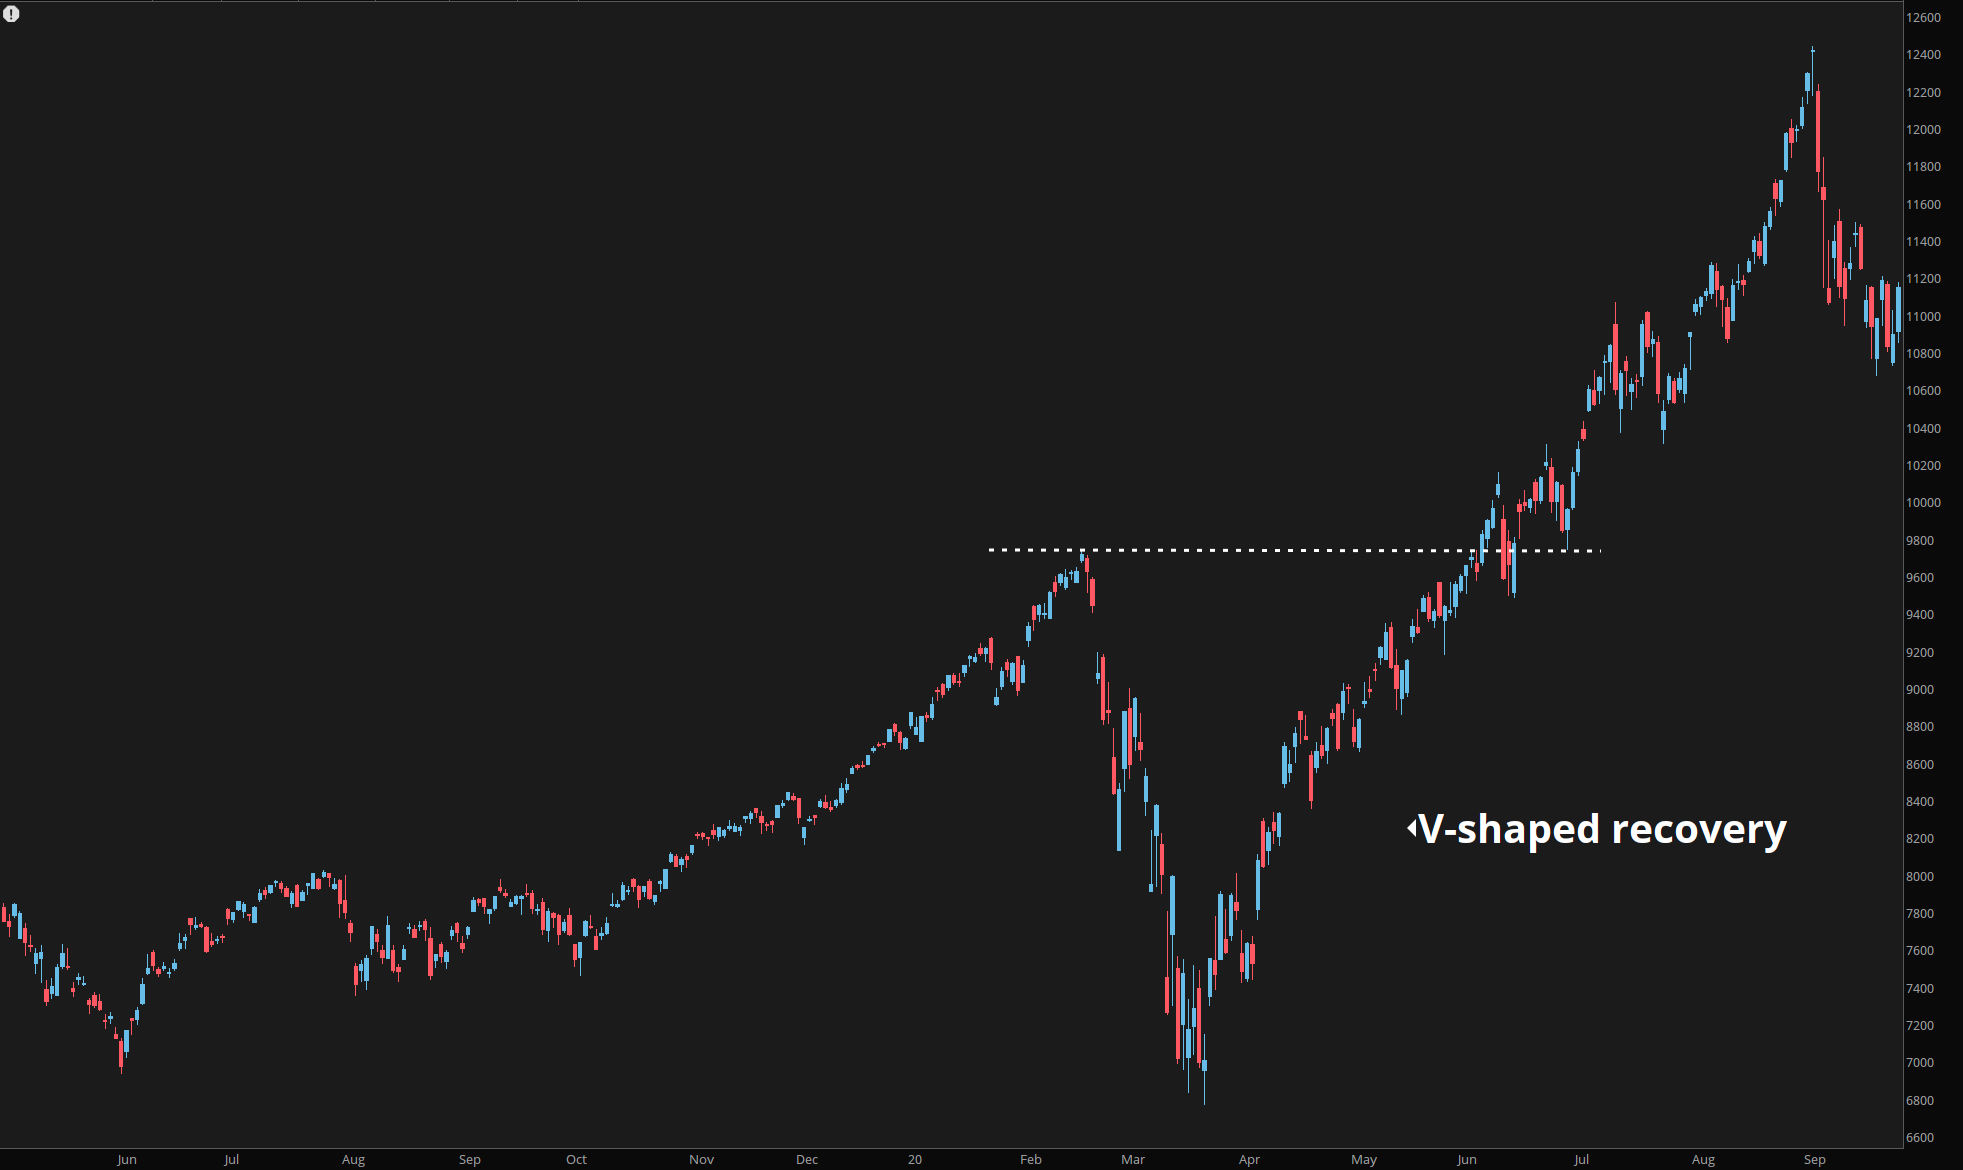 March 2020: The fastest bear market in history followed by the most aggressive monetary response ever
COVID-19 created the ultimate stress test. The Nasdaq plunged 30% in five weeks as the global economy essentially shut down. What followed was the most aggressive monetary and fiscal response in modern history.
The Fed didn’t just cut rates to zero—they unleashed quantitative easing on a scale that made 2008 look restrained. Congress fired up the fiscal cannon with trillions in stimulus. The result? A 300% rally over the next 18 months.
Again, the catalyst was unmistakable: Federal Reserve stimulus through zero rates and money printing.
2025: The Anomaly
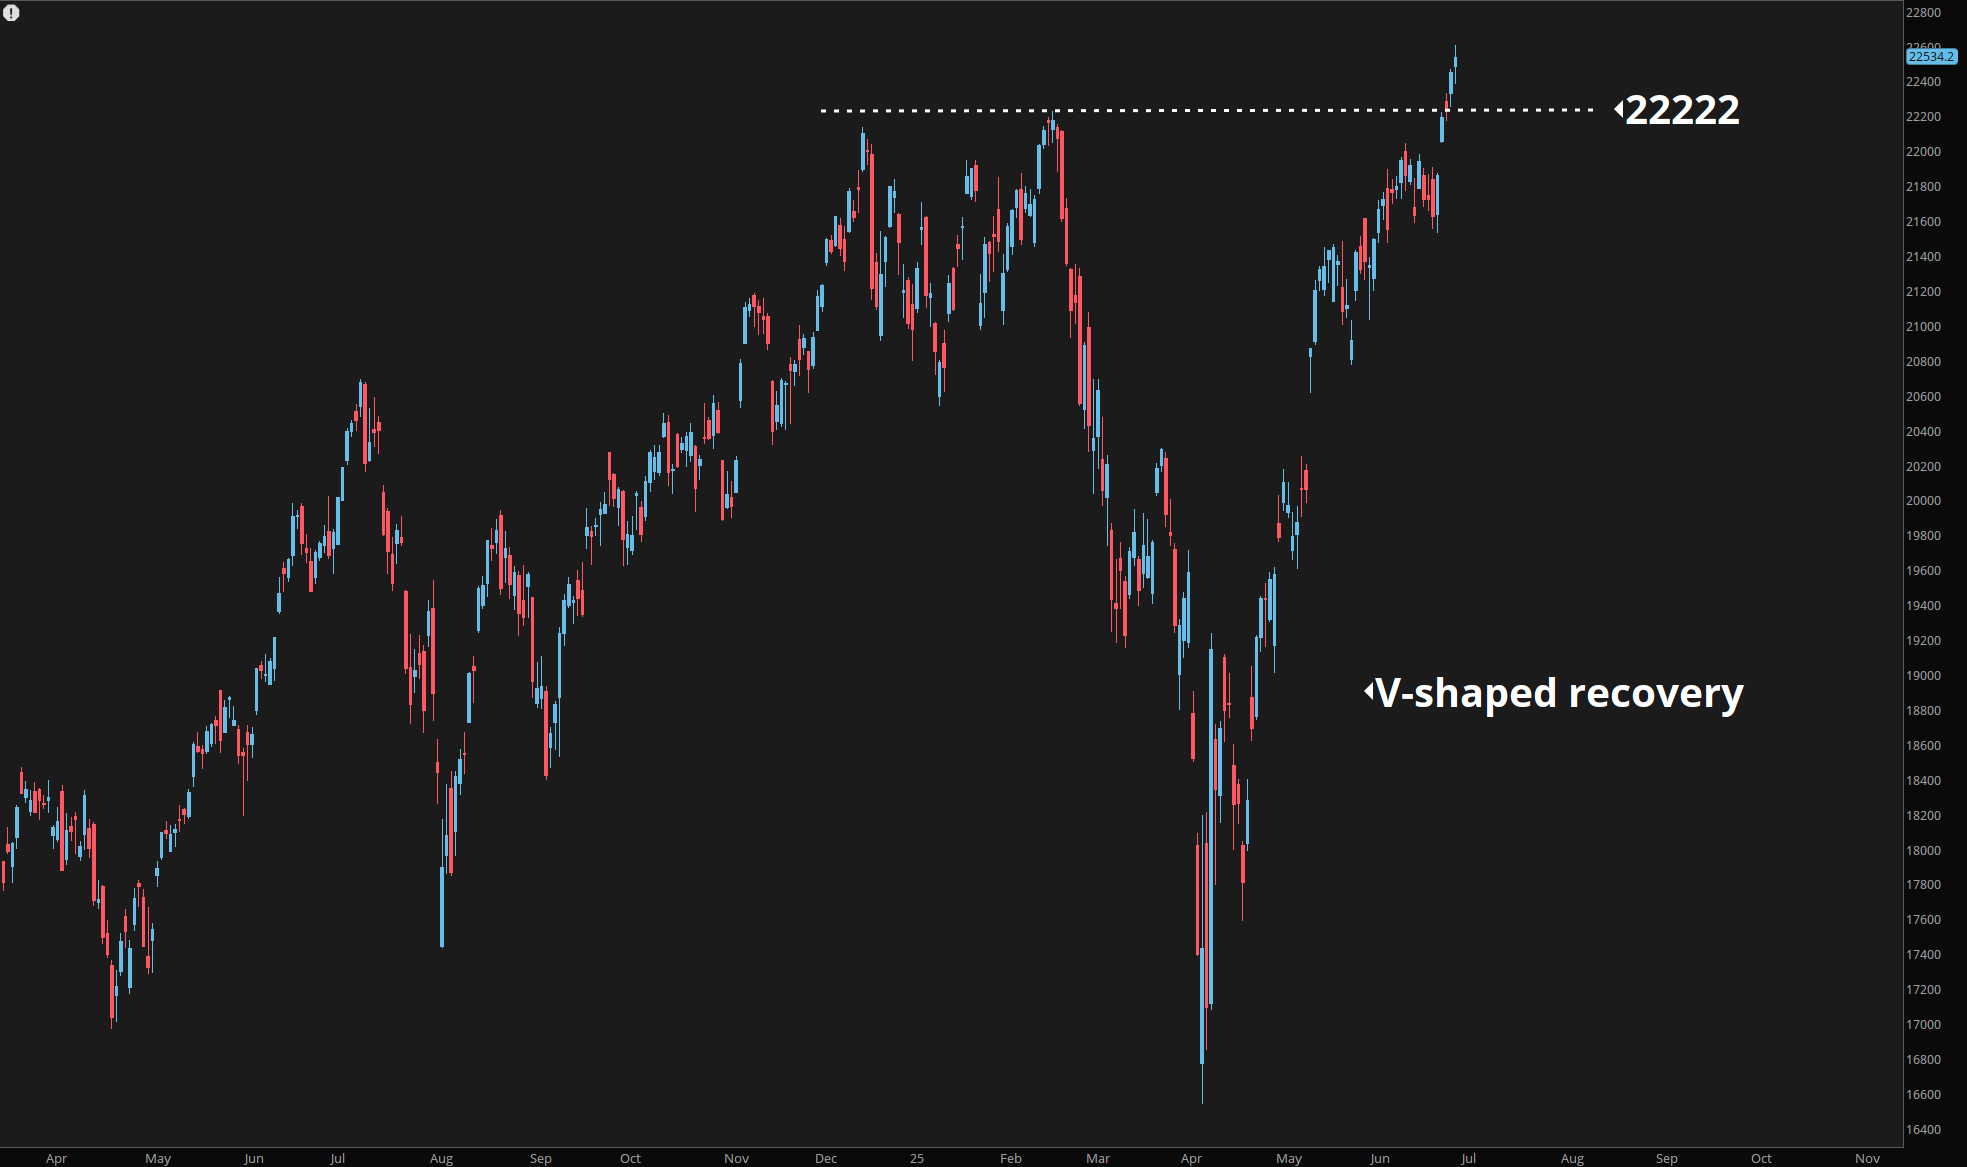 2025: V-shaped recovery happens despite the Fed maintaining restrictive 5.25% rates
This brings us to the current situation, which breaks the established pattern. The Nasdaq just completed its third major V-shaped recovery since 2018, but this time the Federal Reserve isn’t riding to the rescue. Rates remain at 5.25%—levels that would have been considered restrictive in any previous cycle.
So what’s different? If it’s not the Fed driving this rally, what is?
Overview
The Nasdaq Composite’s dramatic surge to new all-time highs represents one of the most compelling V-shaped recoveries in modern market history. After falling nearly 20% in early 2025 amid trade uncertainties and economic headwinds, the tech-heavy index has roared back with unprecedented momentum, breaking through key resistance levels and establishing new technical benchmarks.
This comprehensive analysis examines the technical patterns, institutional dynamics, and market forces driving this historic rally. We’ll explore why V-shaped recoveries often signal sustained bull markets, identify the key support and resistance levels that matter most to traders, and analyze the broader implications for both active traders and long-term investors navigating this evolving landscape.
From the initial capitulation that marked the bottom to the volume-confirmed breakouts that established new highs, this recovery provides valuable insights into market resilience and the power of technical momentum. Understanding these dynamics is crucial for positioning strategies in what could be an extended bull market cycle.
The Four New Catalysts Replacing Fed Stimulus
When the traditional playbook doesn’t explain market behavior, smart money starts looking for alternative drivers. After extensive analysis of fund flows, policy shifts, and macroeconomic trends, four distinct catalysts emerge as the real force behind this rally.
Catalyst #1: Tariffs as Theater, Not Economic Policy
The Trump administration’s approach to trade policy has evolved significantly from the 2016-2020 playbook. Rather than implementing broad tariffs that would genuinely disrupt global supply chains, the current strategy appears designed to extract concessions through the credible threat of economic pain.
Smart institutional investors have figured this out. The tariff announcements that initially spooked markets in early 2025 are increasingly viewed as negotiating tactics rather than serious policy implementation. This shift in perception has removed a major overhang on multinational tech companies that were pricing in supply chain disruption.
Evidence: Notice how tariff headlines now generate minimal market reaction compared to six months ago. The algos have adapted, and so have portfolio managers.
Catalyst #2: The AI Productivity Revolution Hits Real Numbers
Wall Street loves a good narrative, but it demands real results. The AI story has finally moved beyond venture capital pitch decks and into actual corporate earnings. We’re seeing operational efficiency gains that weren’t theoretical anymore—they’re showing up in margin expansion across the technology sector.
Microsoft’s AI integration boosted productivity metrics by 15% year-over-year. Google’s algorithmic improvements reduced server costs while improving service delivery. Even traditional companies are reporting measurable benefits from AI implementation. When efficiency gains translate directly to bottom-line improvements, equity markets take notice.
The kicker: We’re still in the early innings. The companies leading this charge have massive moats and pricing power that’s becoming more apparent each quarter.
Catalyst #3: Global Liquidity Quietly Expanding Again
Here’s something the financial media hasn’t picked up on yet: global money supply growth has quietly turned positive again. While the Federal Reserve maintained restrictive policy, central banks in Europe, Japan, and emerging markets have begun expanding their balance sheets.
This creates a fascinating dynamic. Dollar-denominated assets become attractive relative to other currencies, even without domestic monetary stimulus. International fund flows are supporting U.S. tech stocks as global investors seek exposure to AI and digital transformation themes.
The data: Cross-border equity flows into U.S. tech stocks hit a 12-month high in Q2 2025, driven primarily by European and Asian institutional investors.
Catalyst #4: Dollar Debasement by Design
Perhaps the most underappreciated factor is the systematic weakening of the dollar that’s occurring despite high interest rates. The U.S. Treasury has subtly shifted toward a weak-dollar policy to support American manufacturing competitiveness.
This creates a goldilocks scenario for Nasdaq companies: they benefit from currency translation gains on international revenue while maintaining pricing power in domestic markets. For multinational tech giants, a weaker dollar can add 2-3% to revenue growth without any operational changes.
Market mechanics: A weaker dollar also makes U.S. assets more attractive to foreign buyers, creating additional demand for tech stocks from overseas investors.
Why This Changes Everything
Beyond Pattern Recognition
Most technical analysts focus on chart patterns without considering the underlying drivers. The 2025 V-shaped recovery is significant not because it follows a familiar technical template, but because it represents a fundamental shift in what drives modern equity markets.
We’re witnessing the emergence of a new market regime where traditional monetary policy tools have diminished influence relative to:
- Technology adoption cycles
- Geopolitical negotiating strategies
- Cross-border capital allocation
- Currency debasement trends
The Persistence Factor
Here’s what makes these four catalysts particularly powerful: they’re not subject to Federal Reserve meeting cycles or political election timelines. AI productivity gains compound over quarters and years. Trade negotiations evolve based on economic leverage rather than monetary policy. Global liquidity flows respond to relative opportunity rather than domestic interest rates.
This suggests the current rally has more sustainable foundations than the stimulus-dependent recoveries of 2018 and 2020.
What This Means for Traders and Investors
Rethinking Market Analysis
The traditional approach of analyzing markets through Federal Reserve policy cycles needs updating. Successful trading and investing in this environment requires understanding how these four new catalysts interact and compound.
For active traders: Focus on companies with direct AI exposure, international revenue streams, and operational efficiency improvements. The old correlation between interest rate expectations and tech stock performance has weakened significantly.
For institutional allocators: Consider increasing exposure to technology companies with sustainable competitive advantages in artificial intelligence and global market penetration. The currency tailwinds and productivity gains create a rare combination of revenue growth and margin expansion.
The Risk Management Angle
Traditional risk models that rely heavily on interest rate sensitivity may be providing false signals. A portfolio that looks diversified based on Fed-era correlations might actually be concentrated in assets that respond similarly to AI adoption rates or global liquidity flows.
Key insight: Hedge strategies should account for the new correlation structure where technology leadership, trade policy outcomes, and international monetary policy carry more weight than domestic rate expectations.
The Bottom Line
A New Market Paradigm
The Nasdaq’s 2025 V-shaped recovery marks more than just another successful technical pattern—it signals the emergence of a post-Federal Reserve market environment. For the first time since the 2008 financial crisis, we’re witnessing a major equity rally driven by factors largely independent of monetary policy.
This shift has profound implications. Markets that can rally despite restrictive interest rates possess a resilience that wasn’t evident during the stimulus-dependent recoveries of 2018 and 2020. The four catalysts driving this rally—trade policy evolution, AI productivity gains, global liquidity expansion, and dollar debasement—operate on different timeframes and respond to different variables than traditional monetary stimulus.
What Comes Next
Smart money is already positioning for a prolonged technology leadership cycle supported by fundamental productivity improvements rather than financial engineering. The companies benefiting from these trends have pricing power, international exposure, and operational leverage that can compound returns regardless of Federal Reserve policy decisions.
For traders: This environment rewards focus on technology adoption rates, international revenue exposure, and operational efficiency metrics over traditional rate-sensitive sectors.
For investors: The shift toward productivity-driven growth suggests higher sustainable returns for companies with genuine competitive advantages in artificial intelligence and global market penetration.
The Bigger Picture
When market behavior stops correlating with traditional economic models, it usually means something fundamental has changed. The 2025 Nasdaq recovery may be remembered as the moment when artificial intelligence transitions from investment theme to economic reality, when trade policy becomes a tool for value creation rather than disruption, and when global capital flows start responding to technological leadership rather than monetary policy cycles.
Whether this proves to be a sustainable new paradigm or another false dawn will depend on how these four catalysts evolve over the coming quarters. But for now, the evidence suggests we’re witnessing something genuinely different in equity market dynamics.
What to Watch Going Forward
Key Indicators for the New Paradigm
Since traditional Federal Reserve-focused indicators have reduced predictive power, market participants need new metrics to gauge the sustainability of this rally:
AI Adoption Metrics: Corporate earnings calls mentioning artificial intelligence productivity gains, implementation timelines, and measurable cost savings.
Trade Policy Signals: The gap between tariff announcements and actual implementation. Wider gaps suggest continued “theater” approach; narrowing gaps could signal genuine policy shifts.
Cross-Border Capital Flows: Weekly data on international purchases of U.S. technology stocks, particularly from European and Asian institutional investors.
Dollar Weakness Sustainability: Whether Treasury policy continues supporting dollar debasement or shifts toward strength to combat potential inflation.
The Path Forward
The next six months will determine whether the 2025 V-shaped recovery represents a temporary departure from Fed-driven markets or a permanent shift toward a new market structure. The four catalysts we’ve identified are powerful, but they’re not immune to disruption.
Scenario planning: If AI productivity gains accelerate and trade negotiations continue progressing, this rally could extend well into 2026. If any of the four catalysts reverse—particularly if trade policy shifts toward genuine protectionism or global liquidity tightens—traditional correlations may reassert themselves.
Bottom line: The market has given us a clear signal about what drives equity performance in the current environment. Smart participants will adapt their analysis accordingly while remaining vigilant for signs that the old paradigm might return.
The Nasdaq’s message is clear: the post-2008 era of Federal Reserve market dominance may finally be ending. What comes next depends on whether these four new catalysts can sustain their influence over the coming quarters.