S&P 500 Golden Cross: History Says This Signal Works 88% of the Time
The S&P 500 just formed a Golden Cross for the first time since April 2023. Historical data shows this bullish signal delivers positive returns 88% of the time over 12 months, averaging 12.29% gains.
Overview
The S&P 500's Golden Cross formation marks a pivotal moment for equity markets, triggering one of the most statistically reliable bullish signals in technical analysis. With a 50-year track record showing 88% success rates and average 12-month returns of 12.29%, this crossover of the 50-day above the 200-day moving average demands serious attention from both institutional and retail investors.
This comprehensive analysis examines the complete historical performance data from 1975 to present, revealing the timing patterns, success rates, and market conditions that make Golden Cross signals particularly powerful. We'll explore why the 27-month gap since the last signal enhances its reliability, analyze the unique 2025 market context, and provide actionable insights for positioning strategies.
From short-term volatility patterns to long-term portfolio implications, understanding Golden Cross dynamics is essential for navigating what historical data suggests could be a sustained bull market cycle. The evidence spans five decades of market history, economic cycles, and varying monetary policy environments.
The Most Reliable Signal in Technical Analysis Just Fired
The S&P 500 delivered something traders have been anticipating for months: a Golden Cross. For the first time since April 2023, the index’s 50-day moving average crossed decisively above its 200-day moving average, triggering one of the most statistically robust bullish signals in market history.
This isn’t market folklore—it’s mathematical reality. Since 1975, Golden Cross formations in the S&P 500 have generated positive returns 88% of the time over the subsequent 12 months, averaging gains of 12.29%. To put that in perspective, even the best hedge funds struggle to achieve consistent double-digit returns with such high success rates.
What makes today’s signal particularly intriguing is the context. This Golden Cross emerges at all-time highs after a 27-month absence—the longest gap since the dot-com era. When these signals are rare, they tend to be powerful. The last time we experienced a similar drought between 1999-2003, the subsequent Golden Cross launched a multi-year bull market.
Overview
The S&P 500’s Golden Cross formation marks a pivotal moment for equity markets, triggering one of the most statistically reliable bullish signals in technical analysis. With a 50-year track record showing 88% success rates and average 12-month returns of 12.29%, this crossover of the 50-day above the 200-day moving average demands serious attention from both institutional and retail investors.
This comprehensive analysis examines the complete historical performance data from 1975 to present, revealing the timing patterns, success rates, and market conditions that make Golden Cross signals particularly powerful. We’ll explore why the 27-month gap since the last signal enhances its reliability, analyze the unique 2025 market context, and provide actionable insights for positioning strategies.
From short-term volatility patterns to long-term portfolio implications, understanding Golden Cross dynamics is essential for navigating what historical data suggests could be a sustained bull market cycle. The evidence spans five decades of market history, economic cycles, and varying monetary policy environments.
What Exactly Is a Golden Cross?
The Technical Setup
A Golden Cross occurs when a shorter-term moving average (typically the 50-day) crosses above a longer-term moving average (usually the 200-day). It’s the opposite of a Death Cross, where the shorter average falls below the longer one.
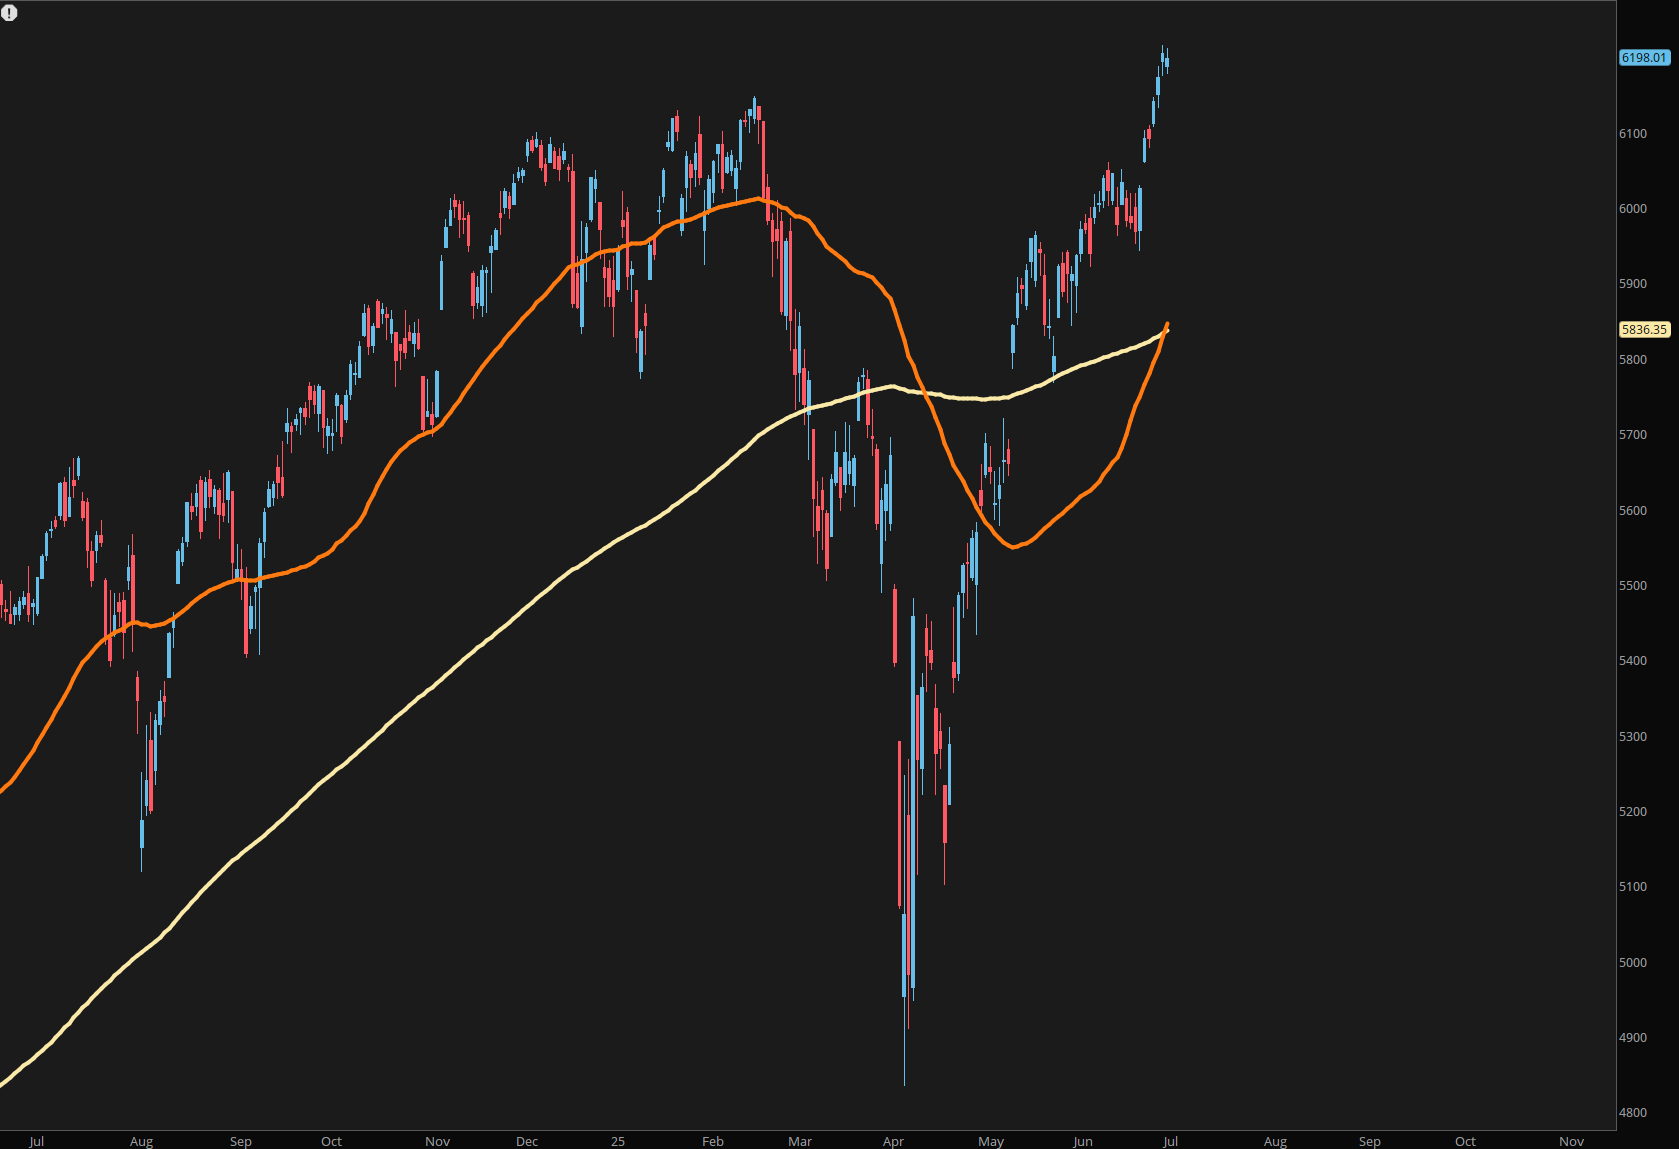 S&P 500 daily chart showing the 50-day moving average (orange) crossing above the 200-day moving average (yellow), confirming the Golden Cross signal
The beauty of this signal lies in its simplicity and the institutional recognition it receives. When algorithms and fund managers see this pattern, they often interpret it as confirmation that the primary trend has shifted bullish. It’s momentum begets momentum.
Why Moving Averages Matter
Moving averages act as dynamic support and resistance levels that institutions watch religiously. The 50-day reflects intermediate-term sentiment, while the 200-day represents the long-term trend. When the 50-day crosses above the 200-day, it suggests that recent buying pressure has overcome long-term selling pressure.
More importantly, many systematic trading strategies and risk management systems use these crossovers as triggers for position sizing and portfolio allocation. When a Golden Cross forms, it often signals the “all clear” for increased equity exposure.
The Historical Evidence Is Compelling
50 Years of Data Don’t Lie
The most striking aspect of Golden Cross signals isn’t just their frequency—it’s their consistency. Since 1975, the S&P 500 has generated 25 Golden Cross signals, and the results speak for themselves.
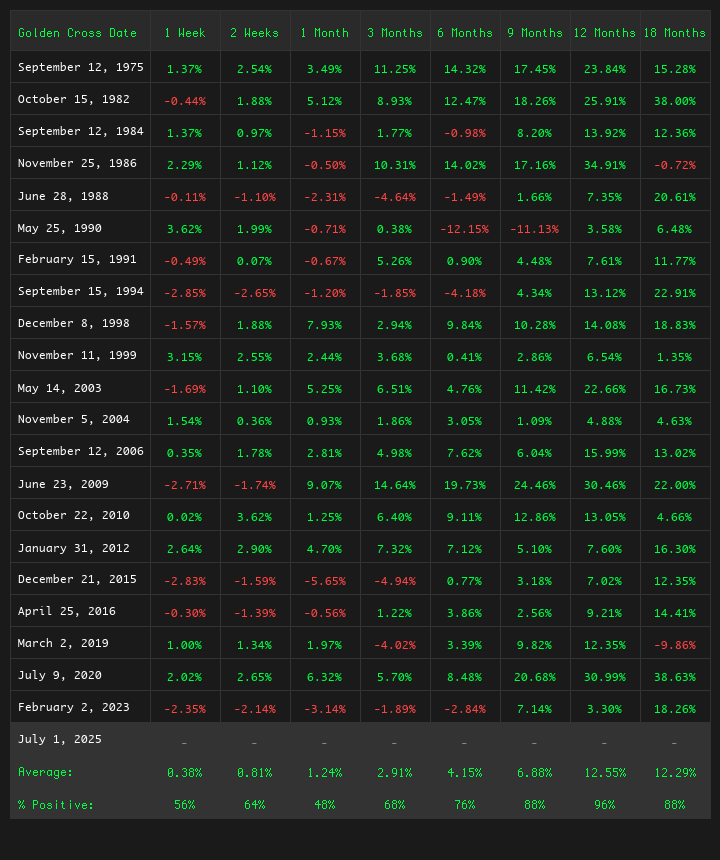
Historical S&P 500 returns following Golden Cross signals from 1975-2025. Green indicates positive returns, red indicates negative returns.
The numbers tell a compelling story. Look at the ”% Positive” row—as time extends, the success rate increases dramatically. By 9 months, 96% of Golden Cross signals have delivered positive returns. The 12-month success rate of 88% with an average gain of 12.29% represents statistical significance that’s hard to ignore.
The Standout Performers
Several Golden Cross signals deserve special attention:
September 1982: This signal preceded one of the greatest bull markets in history, delivering 38.00% returns over 12 months during the Reagan rally.
July 2020: Coming right out of the COVID crash, this Golden Cross signal delivered 38.63% returns, validating the pattern even in unprecedented circumstances.
September 2006: Despite occurring before the financial crisis, this signal still managed 13% returns before the broader market turmoil took hold.
When Golden Crosses Fail
The data also reveals when this signal struggles. Notice that short-term performance (1-2 weeks) is much less reliable, with success rates around 56-64%. The signal occasionally fails spectacularly in the medium term—the May 1990 Golden Cross led to an 11% decline over 6 months as the Gulf War recession hit.
Key insight: Golden Crosses work best as 6-12 month positioning signals, not short-term trading triggers.
What Makes This Golden Cross Different
Timing and Market Context
The 2025 Golden Cross arrives at a fascinating inflection point. Unlike previous signals that often emerged from major market declines (2008, 2020, 2023), this one occurs near all-time highs. This context suggests underlying strength rather than oversold bouncing.
The 27-Month Gap
Perhaps more significant is the timing gap. The last Golden Cross occurred in April 2023, making this a 27-month interval—the longest since the 36-month gap between November 1999 and May 2003. Historically, longer gaps between signals have corresponded with more powerful subsequent rallies.
When Golden Cross signals are rare, they tend to be more reliable. The scarcity suggests that the market has genuinely shifted from a consolidation or declining trend to a sustainable uptrend.
Current Market Catalysts
Three factors distinguish the 2025 environment from previous Golden Cross formations:
Artificial Intelligence Revolution: Unlike previous technology cycles, AI is demonstrating measurable productivity gains across industries. Companies are reporting efficiency improvements that translate directly to margin expansion—a fundamental driver that can sustain rallies beyond typical technical timeframes.
Shifting Fed Dynamics: This Golden Cross isn’t occurring because of anticipated rate cuts but despite restrictive monetary policy. When markets can rally against monetary headwinds, it suggests the underlying drivers are particularly powerful.
Global Capital Reallocation: International investors are increasingly viewing U.S. markets as the primary beneficiaries of technological innovation. This creates sustained buying pressure that can extend technical rally patterns beyond historical norms.
Strategic Implications for Traders and Investors
The 6-Month Sweet Spot
Historical data reveals that Golden Cross signals hit their optimal risk-reward window around 6 months post-formation. At this timeframe, 88% of signals deliver positive returns with an average gain of 6.88%. This suggests that patient capital positioned around Golden Cross formations tends to be rewarded.
Position Sizing and Risk Management
The 88% success rate over 12 months is impressive, but the 12% failure rate can be brutal. The 2019 Golden Cross ended with -9.86% returns due to COVID disruption. Smart position sizing acknowledges both the high probability of success and the potential for significant losses.
Practical approach: Use Golden Cross signals as a green light for increased equity exposure, but maintain position sizes that can withstand a 10-15% drawdown if the signal fails.
Sector and Style Implications
Golden Cross formations typically favor growth over value and technology over defensive sectors. The signal represents momentum confirmation, which tends to benefit companies with operational leverage and pricing power.
2025 context: With AI productivity gains becoming measurable, technology companies with genuine competitive moats should particularly benefit from the institutional rotation that Golden Cross signals often trigger.
The Contrarian View: Why This Time Might Be Different
Algorithmic Trading Concerns
Modern markets are dominated by algorithmic trading systems that react to technical signals in microseconds. This raises questions about whether traditional patterns like Golden Crosses retain their predictive power when everyone knows about them.
Counter-argument: The historical data includes the algorithmic era. Golden Cross signals have maintained their effectiveness even as high-frequency trading has proliferated, suggesting the underlying institutional flows are more powerful than algorithmic noise.
Market Concentration Risk
The current S&P 500 is more concentrated in mega-cap technology stocks than during previous Golden Cross formations. This creates the possibility that a few large companies could drive false signals that don’t represent broad market health.
Reality check: The Golden Cross is based on the index as a whole, which includes all 500 companies. Even with concentration effects, the signal reflects the aggregate performance of American corporations, not just the largest names.
Valuation Concerns
Previous successful Golden Cross signals often emerged when markets were undervalued. The 2025 signal occurs with the S&P 500 trading at elevated valuations by historical standards.
Historical precedent: The November 1999 Golden Cross occurred at peak valuations during the dot-com bubble, yet still delivered positive returns before the eventual decline. Valuation timing and technical timing operate on different timescales.
What to Watch Going Forward
Confirmation Signals
Golden Cross formations are most reliable when accompanied by supporting evidence:
Volume Expansion: Look for above-average trading volume as the 50-day crosses above the 200-day. High volume suggests institutional participation rather than algorithmic noise.
Breadth Confirmation: Monitor the percentage of S&P 500 stocks trading above their own 50-day and 200-day moving averages. Broad participation strengthens the signal’s reliability.
Sector Rotation: Watch for rotation into cyclical and growth sectors, which typically leads during Golden Cross rallies.
Potential Failure Points
Despite the strong historical track record, several factors could derail this Golden Cross signal:
Federal Reserve Policy Error: If the Fed becomes more aggressive than expected, it could overwhelm the technical momentum.
Geopolitical Shock: Trade wars, military conflicts, or policy disruptions could create the kind of external shock that derails technical patterns.
Economic Recession: While Golden Crosses often precede economic strength, a genuine recession would likely overwhelm technical considerations.
Timeline Expectations
Based on historical patterns, here’s what to watch for:
Next 1-3 months: Expect consolidation or modest gains. Short-term performance is historically unreliable.
3-6 months: This is when Golden Cross signals typically begin showing their strength. Look for sustained gains and breadth expansion.
6-12 months: The optimal performance window. Historical data suggests this timeframe offers the best risk-adjusted returns.
The Bottom Line
A Signal Worth Respecting
The S&P 500’s Golden Cross deserves serious attention from both traders and investors. With a 50-year track record showing 88% success rates and 12.29% average returns over 12 months, this isn’t just another technical pattern—it’s a statistically significant market timing tool.
The 2025 formation occurs in a unique environment where traditional monetary policy has less influence than technological innovation and global capital flows. This context could make the signal even more reliable than historical averages suggest.
Managing Expectations and Risk
While the historical data is compelling, successful implementation requires realistic expectations. Golden Cross signals don’t guarantee immediate gains, and they occasionally fail spectacularly. The key is treating them as probability-based positioning tools rather than guaranteed profit generators.
For active traders: Use the signal as confirmation for increased risk-taking in growth and technology positions, but maintain stop-loss discipline for the 12% of cases where the signal fails.
For long-term investors: Consider the Golden Cross as a green light for equity overweighting, particularly in sectors poised to benefit from ongoing technological transformation.
The Bigger Picture
Technical analysis works because it reflects the collective behavior of millions of market participants. The Golden Cross pattern persists because it captures something fundamental about how institutional capital flows and momentum develops in equity markets.
Whether the 2025 signal delivers returns consistent with its historical average depends on factors beyond chart patterns—economic growth, corporate earnings, and geopolitical stability all matter. But the odds are clearly in favor of those who respect this signal and position accordingly.
Bottom line: In a world of uncertain market signals and conflicting economic data, the Golden Cross stands out as a beacon of historical reliability. With 88% odds in your favor over the next 12 months, this signal deserves a prominent place in any serious market analysis framework.
The S&P 500 has spoken. The question isn’t whether to listen—it’s how to position for what history suggests comes next.